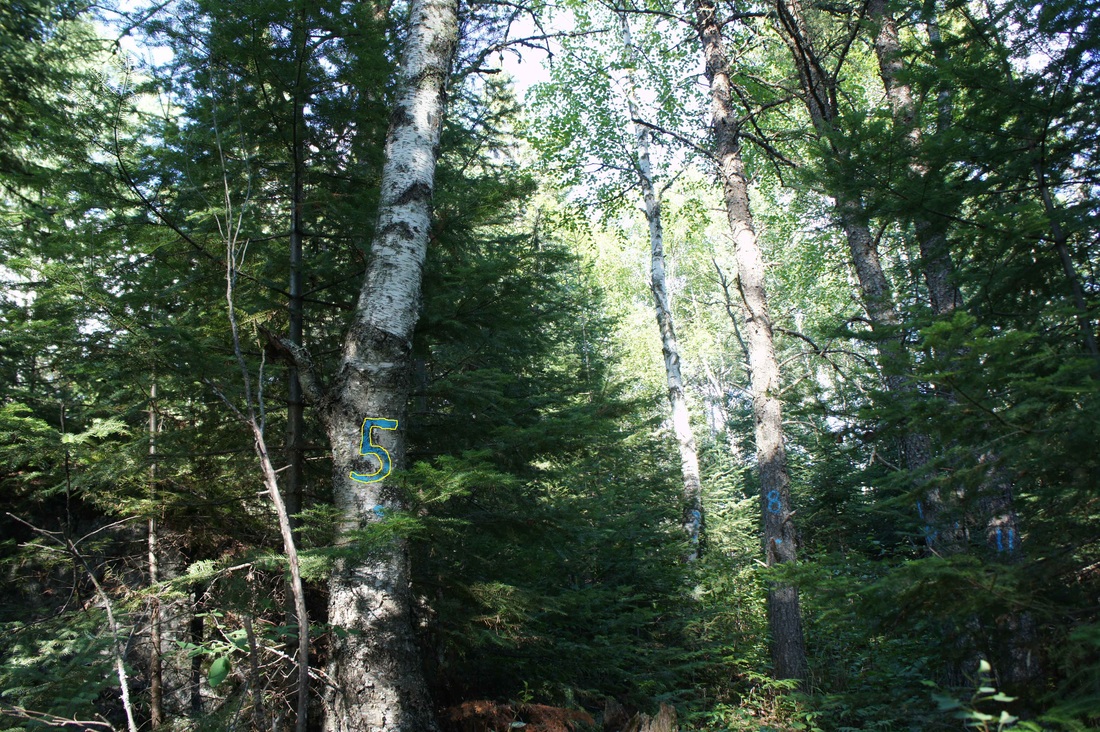
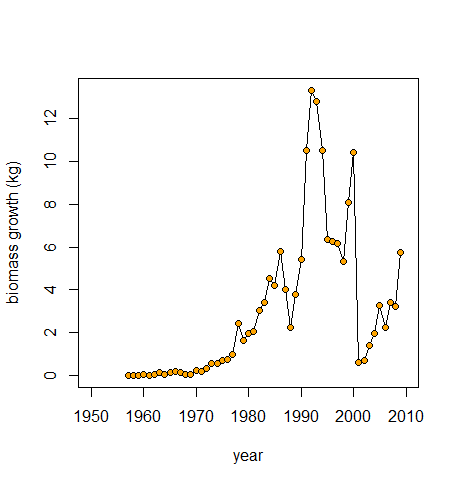
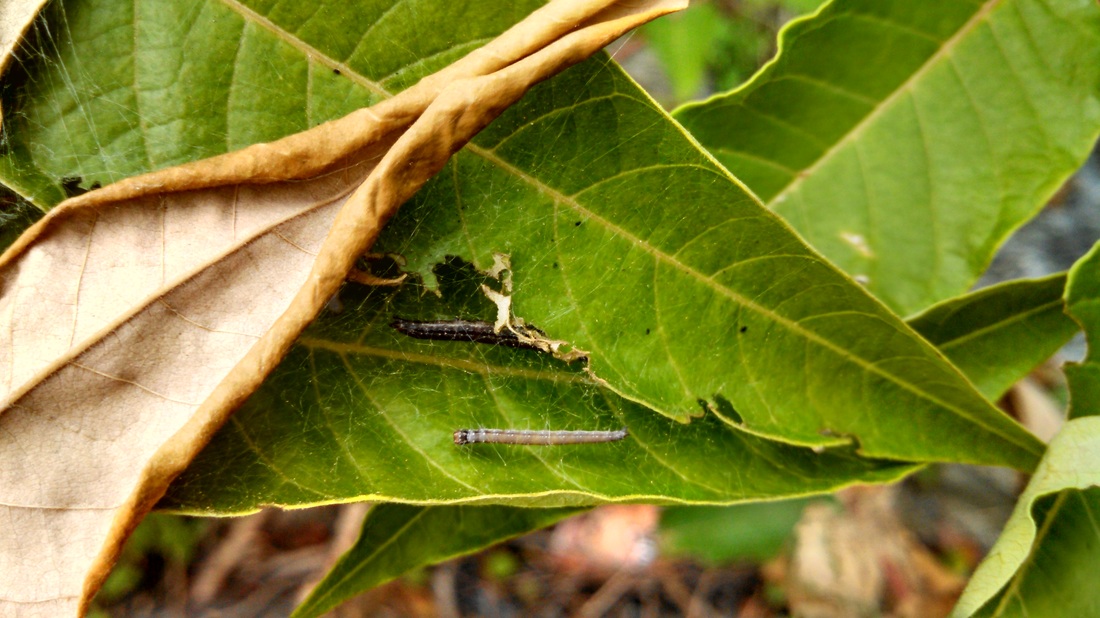
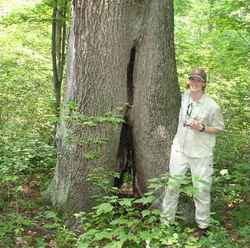
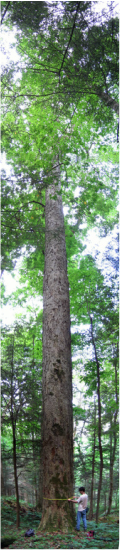
 Paper birch #5 and marked neighbors in Minnesota. Today’s tree has the #5 painted on its trunk in bright blue paint (outlined here in yellow). You can’t tell by looking at it, but after growing well in the 1980’s and 90’s, its growth plummeted in 2001. What happened? This paper birch (Betula papyrifera) lives on a research plot in the Superior National Forest in Minnesota, a very cold part of the country. Paper birch has smooth, white bark that peels off in strips. Because of this unique bark it’s very recognizable. This paper birch grows in a forest that is a mix of trees that lose their leaves every fall (called deciduous trees) and evergreen trees that keep their needles all year round (coniferous trees). Tree 5 is one of our study subjects. We sampled it by extracting a long skinny core out of its trunk to measure its tree rings. We also measured the diameter of its trunk and mapped its location within a circle with a radius of 11 meters. You can see other numbered trees in the background that were measured in the circle (called a plot). Those trees are neighbors of tree 5, and to some extent they compete for resources like sunlight, water and nutrients from the soil. Here’s a map of this plot from a point of view above the canopy. Tree 5 has a red triangle around its location. The photo at the top was taken from the center looking east (to the right). We measured these trees because we want to know how the forest is growing to help forest managers monitor forest health and make plans for the future. We use the tree rings to look back in time and see the growth of each tree since its start as a sapling 50, 100 or even 300 years ago! We carefully measure the width of the tree ring for each year, then we use some calculations to figure out the weight (or mass) of all the wood that grew over the stem and branches. Mass is a good measure to tell us how well a tree is growing in comparison to its neighbors. Once we’ve done our calculations we can make a growth chart for the life of tree 5. What does tree 5’s growth chart tell us about its life and the surrounding forest? For starters, it didn’t grow much in its 1st 20 years, but around 1980 it started growing a lot more wood. It went from producing 1-2 kg of wood each year, to as much as 13 kg in the early 1990’s! Most of its neighbors started growing around the same time, so we can conclude that some event around 1960 reset the forest and allowed small, young trees to get established. Tree 5 grew fast enough to claim a spot in the new forest canopy. Then, in 2001, tree 5’s growth crashed, dropping from 10 kg in 2000 all the way down to 1 kg a year later. This big drop could be a mystery, but we actually know there was a caterpillar outbreak in 2001. Forest tent caterpillars were numerous and hungry enough to eat most of the deciduous leaves by early summer. They were feasting, and the trees were experiencing a famine. Paper birch is one of the trees whose leaves taste best to this caterpillar, and tree 5 did not escape damage. We can be extra sure that this is what happened because we have satellite images from the same year to measure changes in the forest canopy. The caterpillar outbreak lasted 2 years, then went away. Now the question is whether tree 5 can bounce back and grow like it used to, or if the damage will be long-lasting. Right now we just have to wait and see! 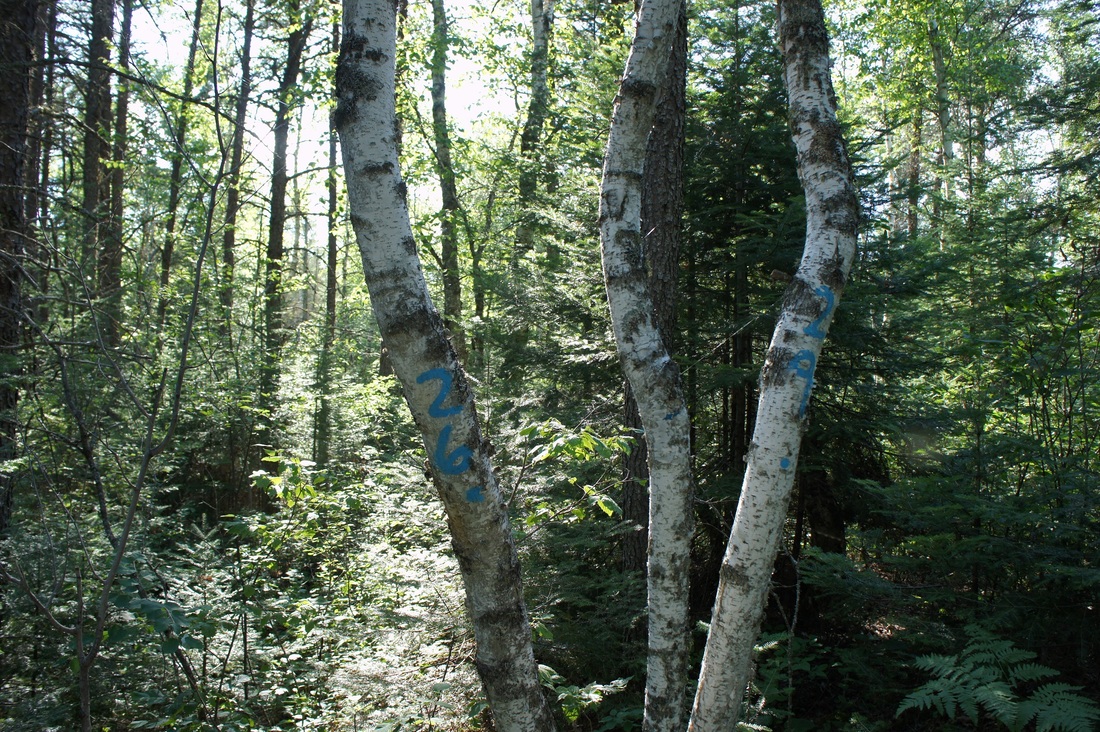 Tree 5's neighbors, looking West.
0 Comments
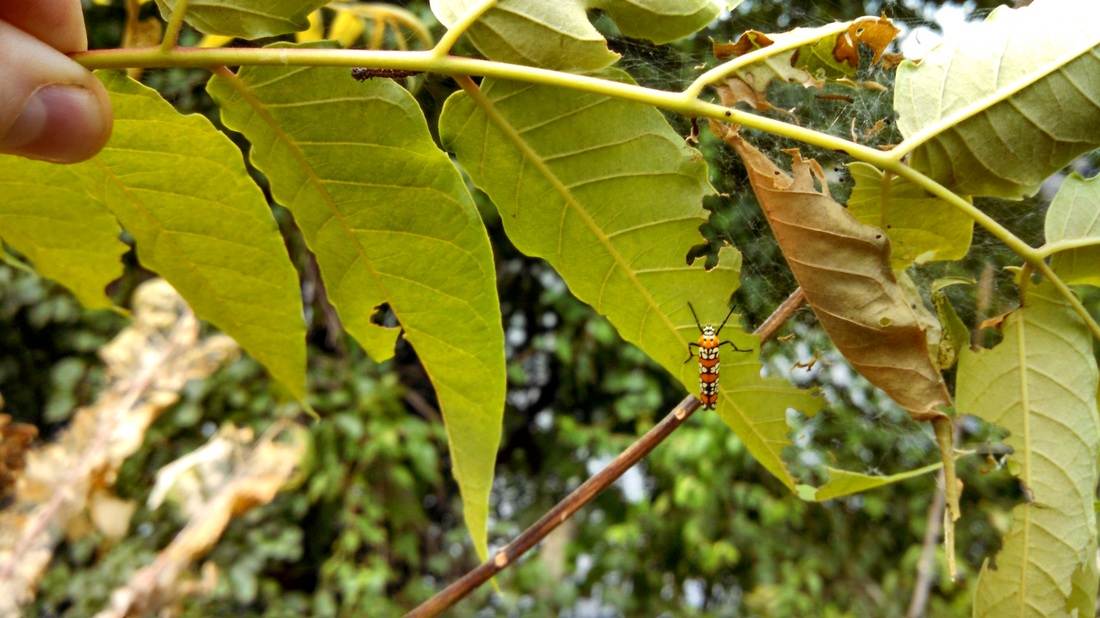
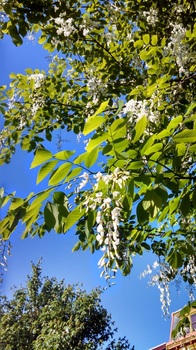
Dendro quiz: Guess how much C each tree took up in 1990. I’ll give you species and standardized ring-width index. Match tree to wood C growth! 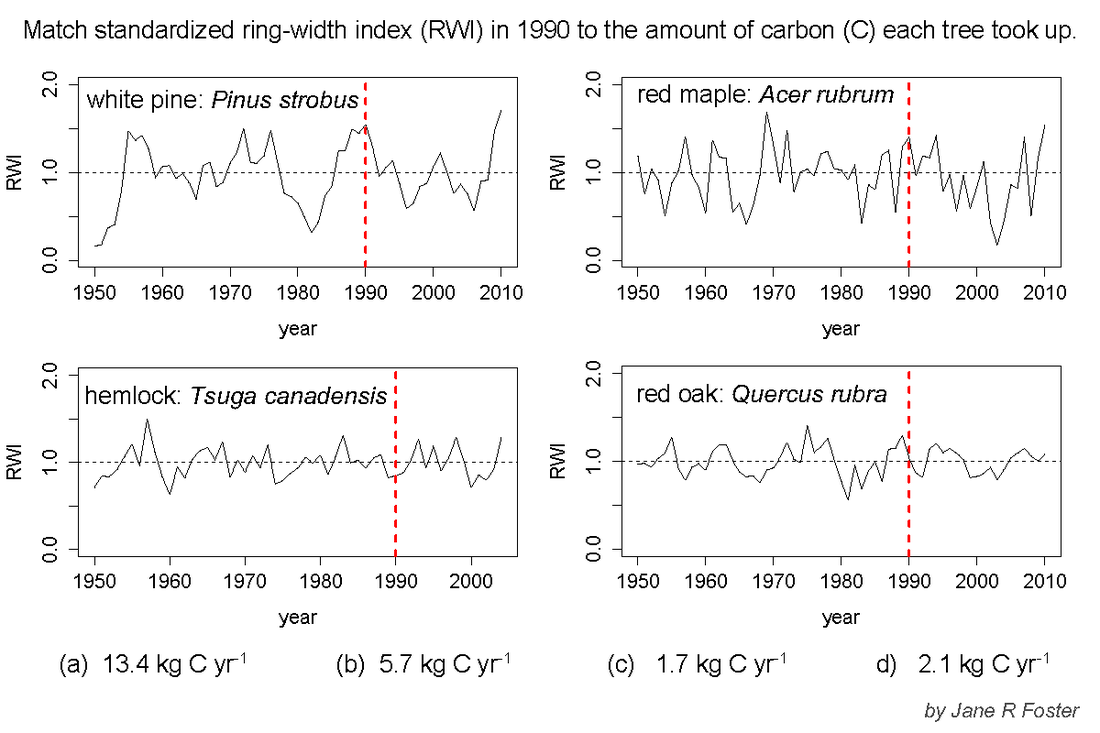 Today we’ll look at 4 trees, using numbers and graphs. I’m going to stray a bit from my target with this entry, to try to illustrate something about tree rings. Tree rings are the concentric circles you see on the cut stem of a tree trunk. There is a category of science dedicated to measuring the width of these rings and accurately placing them in time, by tying each ring to the correct year. It’s called dendrochronology. This is painstaking work, but fascinating. When trees have good conditions for growth, it tends to show up as a wide ring. When a year has bad conditions, a ring can drop to almost nothing. Trees can live hundreds, even thousands of years, so tree ring measurements can tell us about growing conditions during times before human records of rain, snow or temperature. When we want to understand past climate, we often mathematically adjust the ring-widths by showing how each year compares to average growth. This adjusted record is called a standardized ring-width index (or RWI) and that’s what I’ve plotted in the graphs above. For each tree, you can look at how wide a ring was relative to the average, which is shown by the dashed horizontal line. What this index does is highlight whether a year had higher growth than average, or lower. If you look at the top left panel, the white pine had much lower than average growth around 1950 and 1982, but 2010 looked great! One thing forests do for people is take CO2 out of the air and store it in their wood, often for hundreds of years before trees die and decay. This quality of forests is increasingly important because CO2 is a greenhouse gas, we release it with our cars and factories (and our breath) and it makes the atmosphere even warmer. We want forests to take up lots of CO2, but how do we know how much trees are absorbing every year? One way is to use relationships between ring-widths and how much mass they represent when you calculate all the wood that grew as a layer around the stem and branches. This helps us understand how much carbon trees took up in the past, and predict what they will do in the future. Great! So what’s the quiz for? Sometimes measurements that make sense for one type of science question seem fine to use for another type of question. If standardized ring width indices tell us when wood growth is higher or lower than average, shouldn’t we be able to use them to understand how much carbon trees have taken up? Well, test yourself. The answers appear below. How’d you do? Do you see a pattern? What information would help you improve your answer? Please let me know! P.S. Notice the size of the answers. There are about 2.2 lbs in a kilogram (kg), so the tree that gained ~2 kg of C gained ~ 5 lbs. Some trees gain as much carbon weight in a year as some people! Though most gain quite a bit more. Weird! 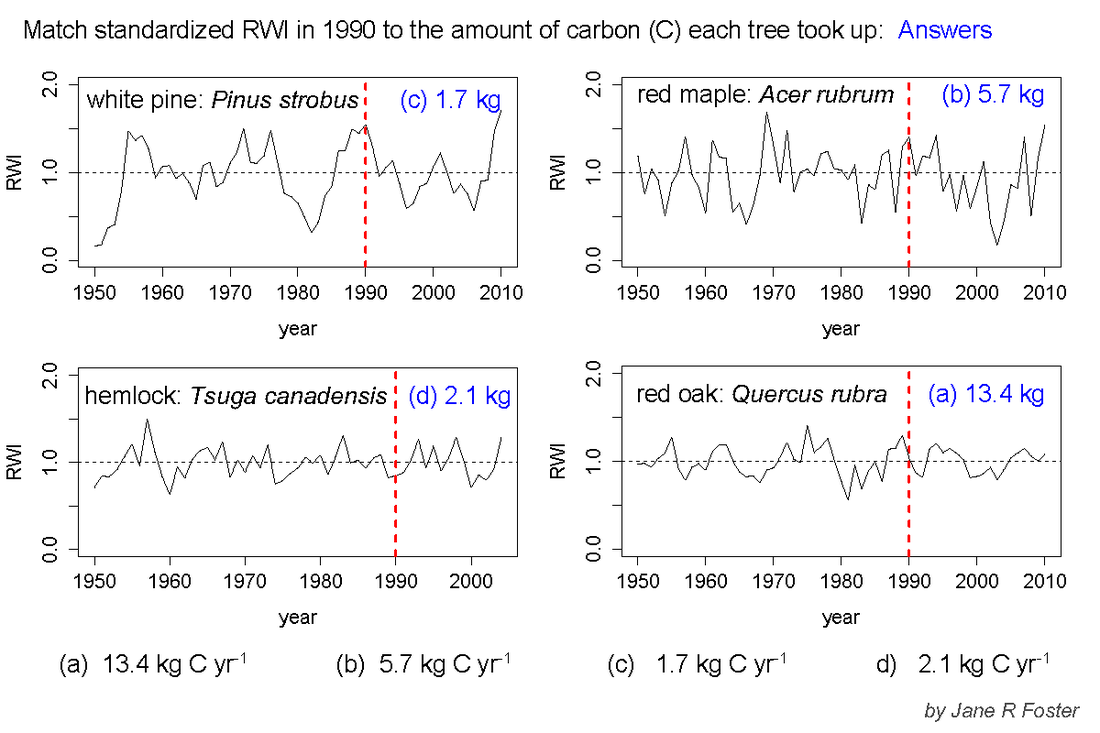 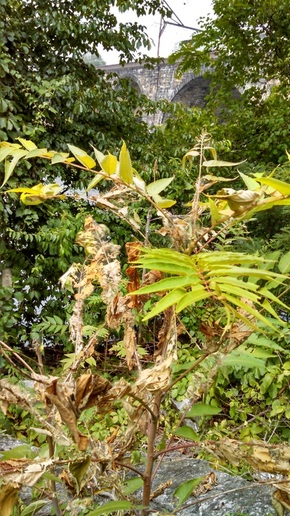 Today’s tree is a member of a species that’s invasive in the US. This means that someone brought trees over from another country (or continent), and since they were introduced, they spread and now compete with many native species. This can be a problem because native tree species often have special long-term relationships with native birds, animals or insects. New invaders don’t typically have those relationships, so they can act like homewreckers when they push native species aside and interrupt some of the family bonds in the forest community. I’ll admit, this little guy doesn’t look very threatening. Half his leaves are brown, and his branches are covered with webs. It’s a small tree of heaven (Ailanthus altissima), growing by the bike path along the Schuykill River in Philly. That’s a typical spot to find a tree of heaven, which originally came over from Asia. They do well in kind of run down areas, where there’s a lot of human traffic. Their leaves smell skunky when you crush them, and because they spread and grow fast they can be a nuisance. I’ll leave it to you to look up nicknames for this tree, but the Chinese name means "foul smelling tree". Now there is a new invader in town. This tree is being feasted on by a group of Ailanthus webworm caterpillars, two of which you can see below. This is a first sighting for me! They turn into orange, white and black moths, and migrate north in the summer to find food like this. While they’re not from the same place as tree of heaven (they’re thought to come from S. Florida and Central America), they seem to like it just fine. As they say, the enemy of my enemy is my friend. I’ll be rooting for the Ailanthus webworm to stick around more and make a dent in the tree-of-heaven population. Keep an eye out, and you might notice them around you too. 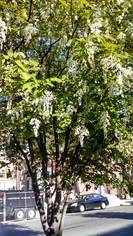 This spring I came upon a tree I didn’t recognize in my Philadelphia neighborhood. It was pumping out a sweet smell from showy flowers, and it grabbed my attention. When I find a tree I can’t identify in the city, I usually assume it’s an ornamental species that’s been imported from another country. That’s pretty common. Who doesn’t want to plant something exotic that none of the neighbors have? But in this case, my assumption was wrong. American yellowwood, Cladrastis kentukea in Latin, is a species native to the United States! How could I have missed such a distinctive tree?
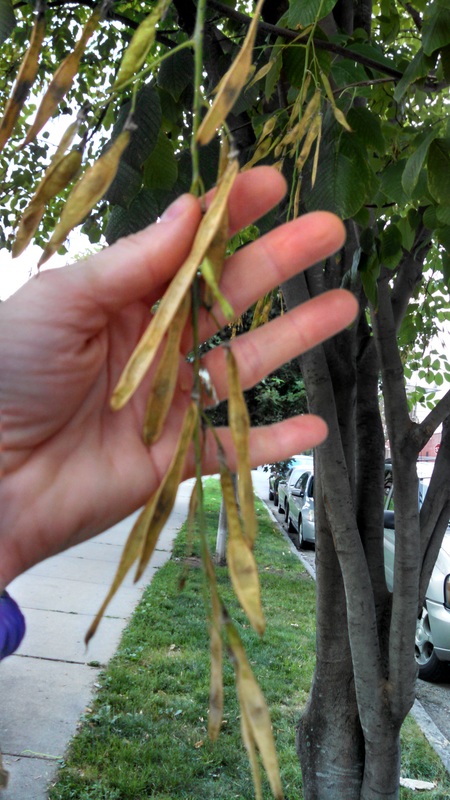
Yellowwood is a legume, which means it’s in the same family as peas. If you’ve ever grown peas or beans in your garden, the shape of the little flowers in these hanging, white clusters will look familiar. I thought this might mean that yellowwood trees have the special ability to harvest nitrogen, like peas do, but it sounds like they didn’t inherit this family trait. Yellowwood do have seeds that grow in pods, just like peas. You can see some of the pods below. Both the flowers and the seeds appear in abundance every few years. Next time I get asked for a tree recommendation for someone’s yard, it’s going to be yellowwood!
|
AuthorI'm a scientist who studies forests. I often need to measure lots of trees to understand why forests change. I think about trees a lot, and sometimes they just become numbers to me: how tall are they? how many are there? how many boards can you get out of them? Archives
October 2015
Categories |


 RSS Feed