|
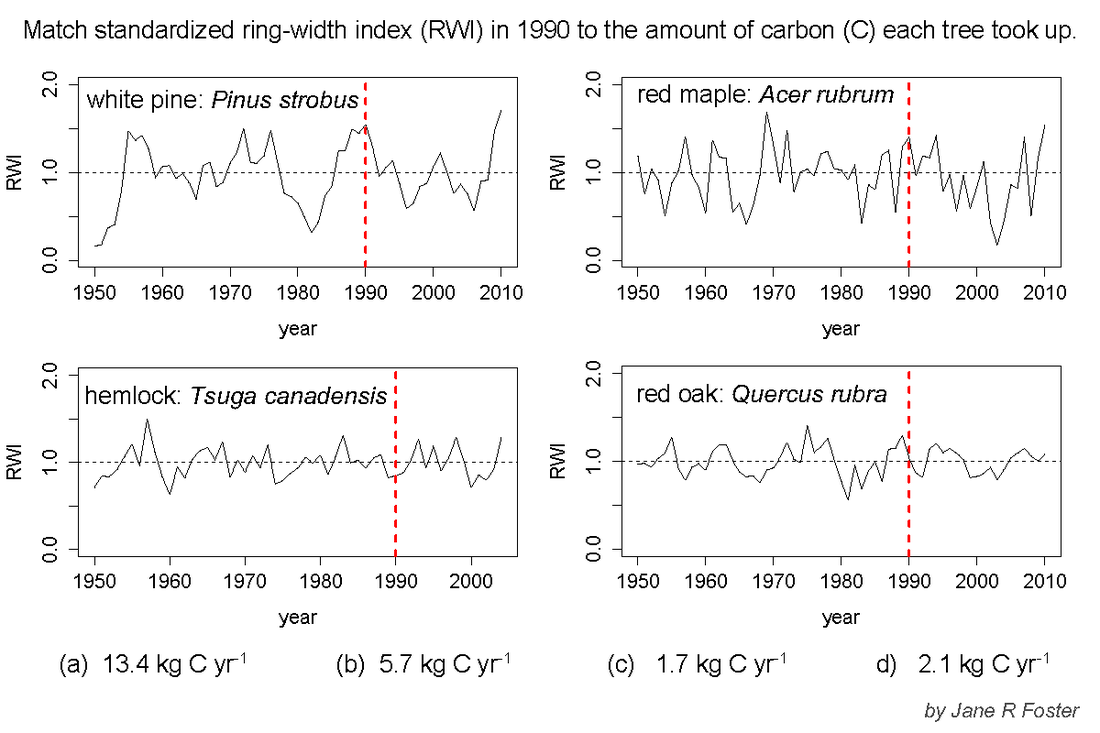
Dendro quiz: Guess how much C each tree took up in 1990. I’ll give you species and standardized ring-width index. Match tree to wood C growth! Today we’ll look at 4 trees, using numbers and graphs. I’m going to stray a bit from my target with this entry, to try to illustrate something about tree rings. Tree rings are the concentric circles you see on the cut stem of a tree trunk. There is a category of science dedicated to measuring the width of these rings and accurately placing them in time, by tying each ring to the correct year. It’s called dendrochronology. This is painstaking work, but fascinating. When trees have good conditions for growth, it tends to show up as a wide ring. When a year has bad conditions, a ring can drop to almost nothing. Trees can live hundreds, even thousands of years, so tree ring measurements can tell us about growing conditions during times before human records of rain, snow or temperature.
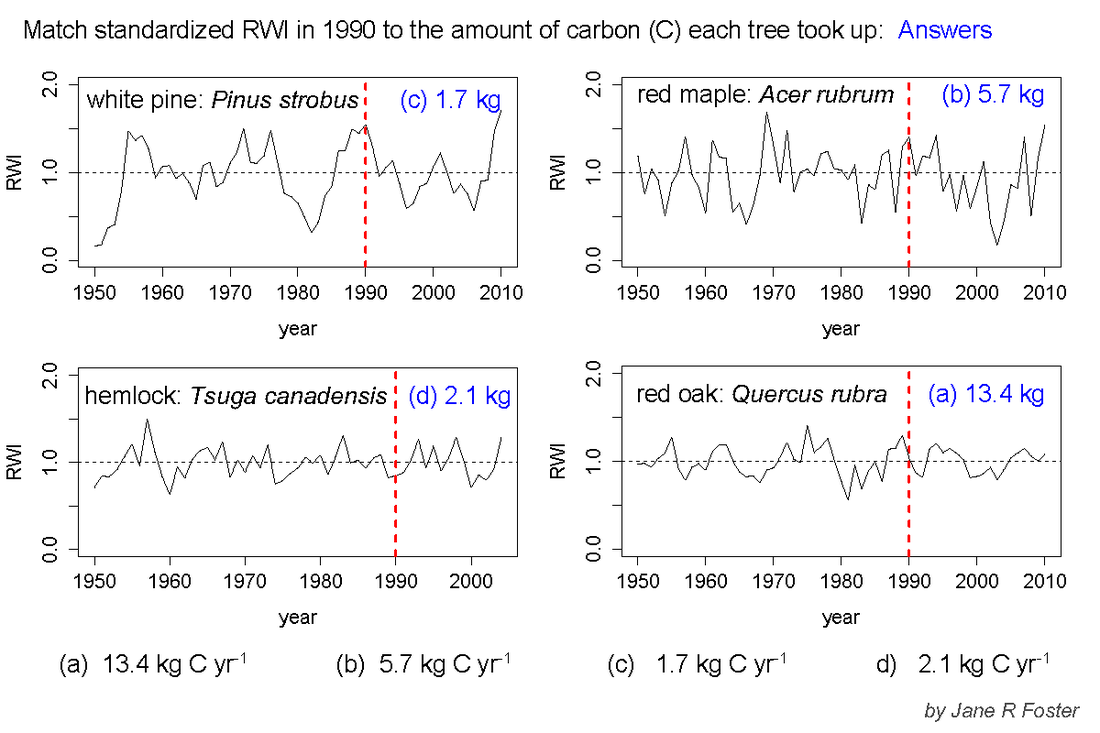
When we want to understand past climate, we often mathematically adjust the ring-widths by showing how each year compares to average growth. This adjusted record is called a standardized ring-width index (or RWI) and that’s what I’ve plotted in the graphs above. For each tree, you can look at how wide a ring was relative to the average, which is shown by the dashed horizontal line. What this index does is highlight whether a year had higher growth than average, or lower. If you look at the top left panel, the white pine had much lower than average growth around 1950 and 1982, but 2010 looked great! One thing forests do for people is take CO2 out of the air and store it in their wood, often for hundreds of years before trees die and decay. This quality of forests is increasingly important because CO2 is a greenhouse gas, we release it with our cars and factories (and our breath) and it makes the atmosphere even warmer. We want forests to take up lots of CO2, but how do we know how much trees are absorbing every year? One way is to use relationships between ring-widths and how much mass they represent when you calculate all the wood that grew as a layer around the stem and branches. This helps us understand how much carbon trees took up in the past, and predict what they will do in the future. Great! So what’s the quiz for? Sometimes measurements that make sense for one type of science question seem fine to use for another type of question. If standardized ring width indices tell us when wood growth is higher or lower than average, shouldn’t we be able to use them to understand how much carbon trees have taken up? Well, test yourself. The answers appear below. How’d you do? Do you see a pattern? What information would help you improve your answer? Please let me know! P.S. Notice the size of the answers. There are about 2.2 lbs in a kilogram (kg), so the tree that gained ~2 kg of C gained ~ 5 lbs. Some trees gain as much carbon weight in a year as some people! Though most gain quite a bit more. Weird!
4 Comments
David Foster
9/25/2015 06:47:47 pm
Ok. RWI seems like a red herring to me. The species are so different per ring. So average carbon per ring is a function of density, composition, but I speculate most important, shape and branching characteristics of the whole tree above the ring!
Reply
Jane Foster
9/28/2015 11:16:30 am
David,
Reply
9/21/2023 10:03:49 am
Great blog post! It's informative and well-written, making the topic easy to understand.
Reply
Leave a Reply. |
AuthorI'm a scientist who studies forests. I often need to measure lots of trees to understand why forests change. I think about trees a lot, and sometimes they just become numbers to me: how tall are they? how many are there? how many boards can you get out of them? Archives
October 2015
Categories |


 RSS Feed